Physics Toolbox Sensor Suite
Contains ads

4.8star
17.1K reviews
1M+
Downloads

Everyone
info


About this app
This app uses internal smartphone sensors to collect, display, record, and export .csv data files. See www.vieyrasoftware.net to (1) read about case usage in research and development, and (2) get lesson plans for educators of science, technology, engineering, and mathematics (STEM) fields, including physics. Sensor availability, precision, and accuracy are dependent upon smartphone hardware.
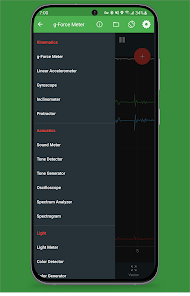
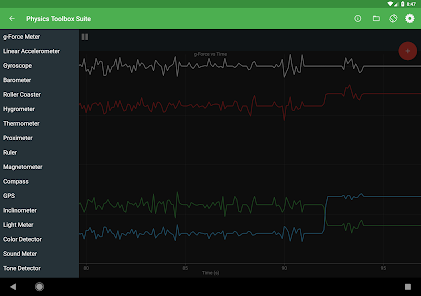
Sensors, generators, and data analysis tools include the following:
KINEMATICS
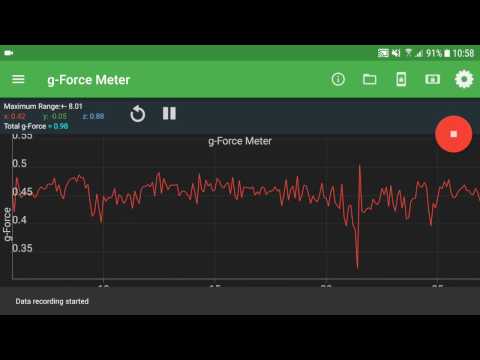
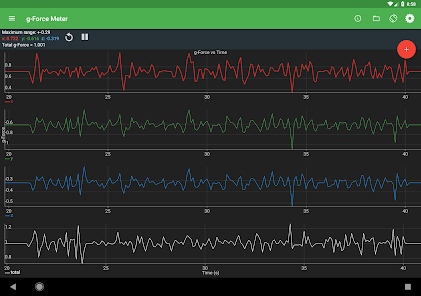
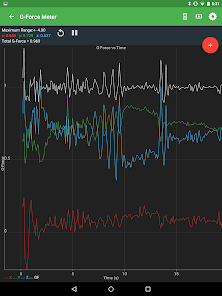
G-Force Meter - ratio of Fn/Fg (x, y, z and/or total)
Linear Accelerometer – acceleration (x, y, and/or z)
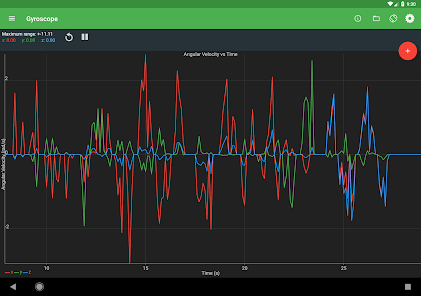
Gyroscope - radial velocity (x, y, and/or z)
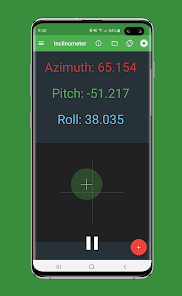
Inclinometer - azimuth, roll, pitch
Protractor - angle from vertical or horizontal
ACOUSTICS
Sound Meter - sound intensity
Tone Detector - frequency and musical tone
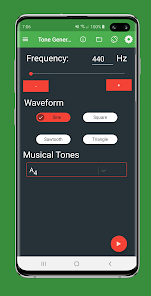
Tone Generator – sound frequency producer
Oscilloscope - wave shape and relative amplitude
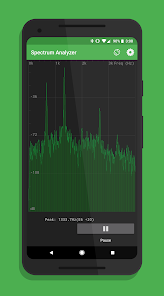
Spectrum Analyzer - graphical FFT
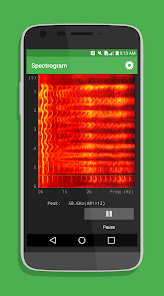
Spectrogram - waterfall FFT
LIGHT
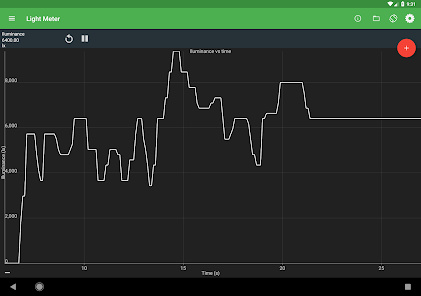
Light Meter - light intensity
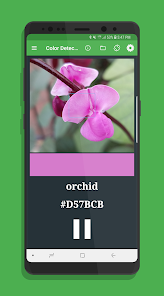
Color Detector - detects HEX colors within a small rectangle area on the screen via the camera.
Color Generator – R/G/B/Y/C/M, white, and custom color screen
Proximeter - periodic motion and timer (timer and pendulum modes)
Stroboscope (beta) - camera flash
Wi-Fi - Wi-Fi signal strength
MAGNETISM
Compass - magnetic field direction and bubble level
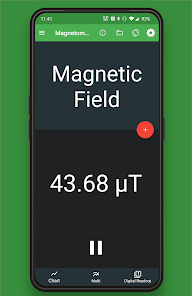
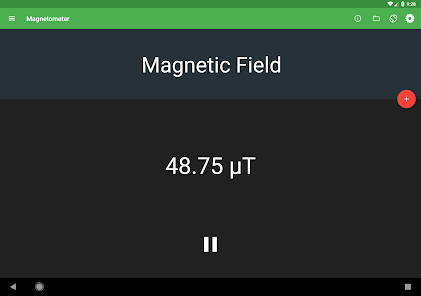
Magnetometer - magnetic field intensity (x, y, z and/or total)
Magna-AR - augmented reality visualization of magnetic field vectors
OTHER
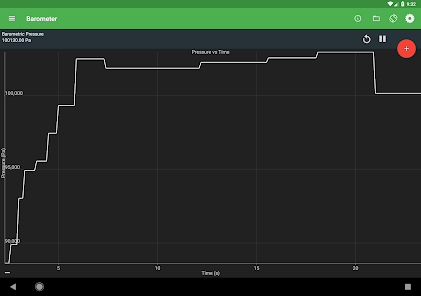
Barometer - atmospheric pressure
Ruler - distance between two points
GPS - latitude, longitude, altitude, speed, direction, number of satellites
System Temperature - battery temperature
COMBINATION
Multi Record - choose one or more of the above sensors to collect data at the same time.
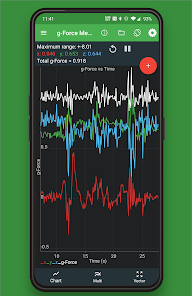
Dual Sensor - display data from two sensors on a graph in real time.
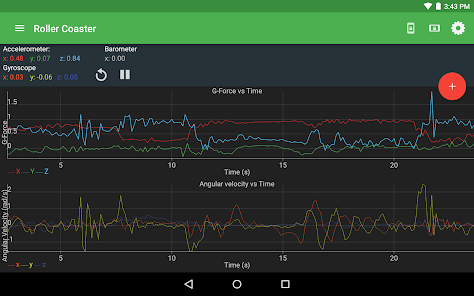
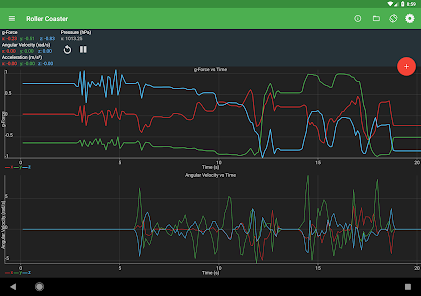
Roller Coaster - G-Force Meter, Linear Accelerometer, Gyroscope, and Barometer
PLOTTING
Manual Data Plot - enter data manually to generate a graph.
GAME
Play - challenges
FEATURES
(a) Record: Record by pressing the red floating action button. Find saved data stored in the folder icon.
(b) Export: Export data by selecting an option to send via e-mail or shared in Google Drive or Dropbox. Locally saved files can also be transferred from the folder icon.
(c) Sensor Information: Clicking on the (i) icon to identify sensor name, vendor, and current data collection rate, and to learn what kind of data is collected by the sensor, its physical operating principle, and links to additional resources.
SETTINGS
* Note that not all settings are available for all sensors.
(a) Data Display: View data in graphical, digital, or vector form.
(b) Graph Display: View multi-dimensional data sets on a single shared graph or in multiple individual graphs.
(c) Displayed Axis: For multi-dimensional data on a single shared graph, select total, x, y, and/or z-axis data.
(d) CSV Timestamp Format: Record clock time or elapsed time with sensor data.
(e) Line Width: Modify visual presentation of data with a Thin, Medium, or Thick line.
(f) Sensor Collection Rate: Set collection rate as Fastest, Game, UI, or Normal. The sensor collection rate is displayed for each option when selected.
(g) Keep the Screen On: Prevent the app from turning the screen off automatically.
(h) Calibrate: Calibrate selected sensors.
Sensors, generators, and data analysis tools include the following:
KINEMATICS
G-Force Meter - ratio of Fn/Fg (x, y, z and/or total)
Linear Accelerometer – acceleration (x, y, and/or z)
Gyroscope - radial velocity (x, y, and/or z)
Inclinometer - azimuth, roll, pitch
Protractor - angle from vertical or horizontal
ACOUSTICS
Sound Meter - sound intensity
Tone Detector - frequency and musical tone
Tone Generator – sound frequency producer
Oscilloscope - wave shape and relative amplitude
Spectrum Analyzer - graphical FFT
Spectrogram - waterfall FFT
LIGHT
Light Meter - light intensity
Color Detector - detects HEX colors within a small rectangle area on the screen via the camera.
Color Generator – R/G/B/Y/C/M, white, and custom color screen
Proximeter - periodic motion and timer (timer and pendulum modes)
Stroboscope (beta) - camera flash
Wi-Fi - Wi-Fi signal strength
MAGNETISM
Compass - magnetic field direction and bubble level
Magnetometer - magnetic field intensity (x, y, z and/or total)
Magna-AR - augmented reality visualization of magnetic field vectors
OTHER
Barometer - atmospheric pressure
Ruler - distance between two points
GPS - latitude, longitude, altitude, speed, direction, number of satellites
System Temperature - battery temperature
COMBINATION
Multi Record - choose one or more of the above sensors to collect data at the same time.
Dual Sensor - display data from two sensors on a graph in real time.
Roller Coaster - G-Force Meter, Linear Accelerometer, Gyroscope, and Barometer
PLOTTING
Manual Data Plot - enter data manually to generate a graph.
GAME
Play - challenges
FEATURES
(a) Record: Record by pressing the red floating action button. Find saved data stored in the folder icon.
(b) Export: Export data by selecting an option to send via e-mail or shared in Google Drive or Dropbox. Locally saved files can also be transferred from the folder icon.
(c) Sensor Information: Clicking on the (i) icon to identify sensor name, vendor, and current data collection rate, and to learn what kind of data is collected by the sensor, its physical operating principle, and links to additional resources.
SETTINGS
* Note that not all settings are available for all sensors.
(a) Data Display: View data in graphical, digital, or vector form.
(b) Graph Display: View multi-dimensional data sets on a single shared graph or in multiple individual graphs.
(c) Displayed Axis: For multi-dimensional data on a single shared graph, select total, x, y, and/or z-axis data.
(d) CSV Timestamp Format: Record clock time or elapsed time with sensor data.
(e) Line Width: Modify visual presentation of data with a Thin, Medium, or Thick line.
(f) Sensor Collection Rate: Set collection rate as Fastest, Game, UI, or Normal. The sensor collection rate is displayed for each option when selected.
(g) Keep the Screen On: Prevent the app from turning the screen off automatically.
(h) Calibrate: Calibrate selected sensors.
Updated on
Safety starts with understanding how developers collect and share your data. Data privacy and security practices may vary based on your use, region, and age. The developer provided this information and may update it over time.

No data shared with third parties
Learn more about how developers declare sharing

This app may collect these data types
App activity and App info and performance

Data is encrypted in transit

Data can’t be deleted
Ratings and reviews
4.8
16.5K reviews

Zak Tucker
- Flag inappropriate
May 10, 2024
Lots of neat features which I enjoy. Downloaded for my daughter to measure G-forces on roller coasters. Biggest downside is saving the data. It will save the data but it will not open it. Only option is to delete the data recorded during the ride. Needs a more user friendly interface for viewing the data saved.
Vieyra Software
May 11, 2024
Hi Zak, you can indeed record and then immediately export the data via the share function (it will send a .csv to your email, for example, or you can save it to the phone storage). The function to re-open the file within the app is restricted to our Pro version. The funds we receive from Pro help support ongoing maintenance of this free app.

Jon Bray
- Flag inappropriate
November 17, 2021
This app adds more value to your phone then any other. After a few years of use I've had a chance to test every tool against scientific-grade measuring devices. All are as accurate as purpose-made devices, the ones that aren't spot on the difference is not statistically significant. The practical uses are endless: being able to triangulate the location of a sound in my house or measure brightness and distance without a toolbelt is amazing.
7 people found this review helpful
Vieyra Software
March 22, 2017
We are glad to know you find the app very useful. If you have any feedback feel free to let us know at support@vieyrasoftware.net and also do not forget to visit our website at vieyrasoftware.net

Ananya Gupta
- Flag inappropriate
August 3, 2022
This is a fantastic app that does exactly what you need with a variety of options. It will also record your readings for whatever sensor you choose. I wish you could do simultaneous multiple sensor reading and recording in a single graph. That would be interesting. That being said, you cannot go wrong. If you need to test or record values for any sensor on your phone, another awesome thing would have been the ability to enable and set time-based recording by a sensor or event-based.
20 people found this review helpful
Vieyra Software
September 5, 2022
Hi, we do have the Multi record feature, but it does not plot all data on a single graph...for that, you would need to export data and plot it yourself. However, this feature is on our roadmap, so perhaps you will see it come soon. Thanks for the additional recommendation of time-based or event-based recording. We will add that to our list!
What's new
Bug fixes


